Competitive Benchmarking of neetoDesk and neetoChat
Identified Competitors
Zendesk
Freshdesk
Zendesk and Freshdesk has a comprehensive of reporting helping them manage their customer support tickets efficiently.
In comparison, neetoDesk and neetoChat reports have metrics related to Volume (i.e., Closed Tickets, Open Tickets, New Tickets on neetoDesk; Open Conversations, Closed Conversations, New Conversations, Unassigned Conversations, Replies sent and Replied Conversations on neetoChat)
In order to make the reports meaningful and effective, following pointers can be implemented
Addition of metrics
Option for creating customized reports
Option for exporting reports
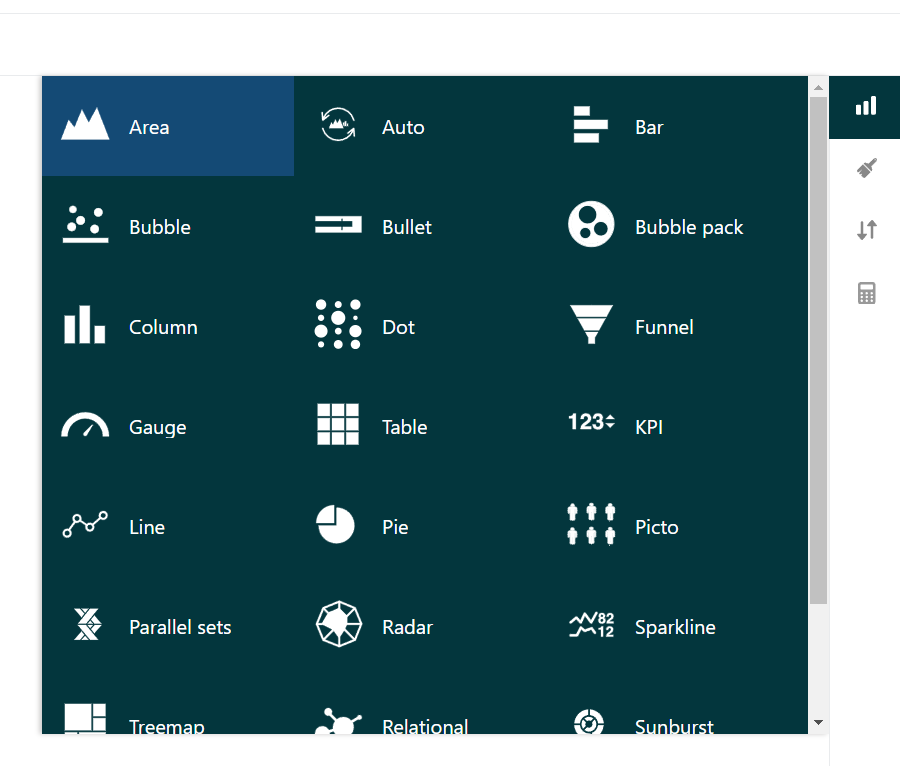
Visualization options in reports
-
Mathematical functions for metrics
1. Metrics
Following metrics can be included in the current reports of neetoDesk and neetoChat to make it insightful and effective.
First Response Time (FRT) - FRT reflects the speed of acknowledgment and engagement with customers which is useful to track how promptly the touchpoints are created with the customers.
First Contact Resolution (FCR) Rate - The percentage of support tickets resolved on the first interaction with the customer, without needing to escalate or follow up.
Ticket Resolution Time/ Query Resolution Time - TRT measures the efficiency of the agents in addressing customer issues promptly.
Resolution within SLA % - Measures the percentage of customer support tickets that are resolved within the agreed-upon Service Level Agreement (SLA) timeframe.
Ticket Escalation Rate - The percentage of tickets that need to be escalated to higher-level support or management.
Ticket Backlog - The number of unresolved tickets at any given time.
Repeats Tickets - Repeat ticket rate indicates recurring problems or unresolved issues
Furthermore, similar metrics can be grouped together for better insights.
Today's Trend : Resolved tickets, Received tickets, Average first response time, Average next response time, Tickets solved within SLA.
Ticket Volume : New tickets, Open tickets, Closed tickets, Waiting on customer tickets, On hold tickets, Repeat tickets, Reopened tickets, Escalated tickets.
Activity : First Response Time, Next Response Time, First Contact Resolution Time, Ticket Resolution Time, Average Agent assign time, Resolution SLA %.
Agent Performance : Assigned, Closed, First Response Time, Resolution Time, Violations.
-
Customer Satisfaction
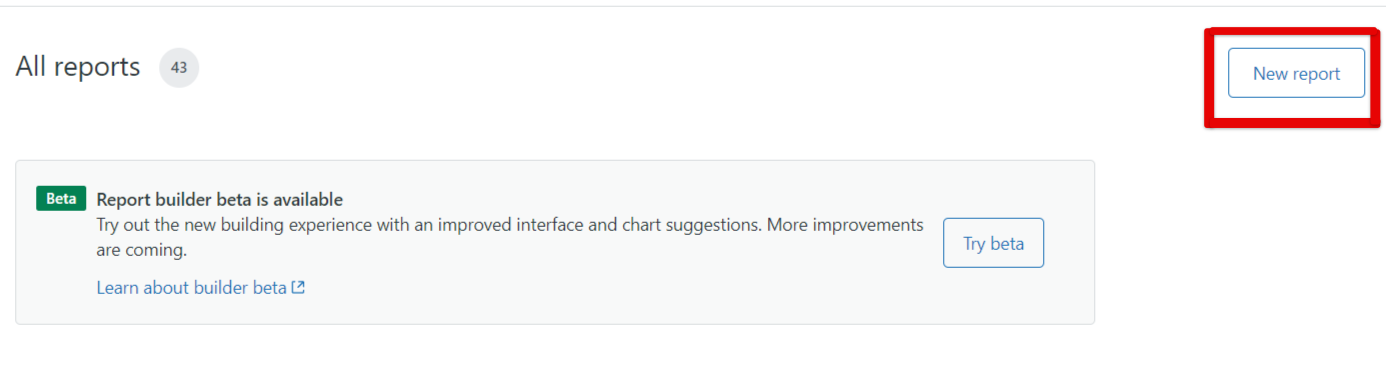
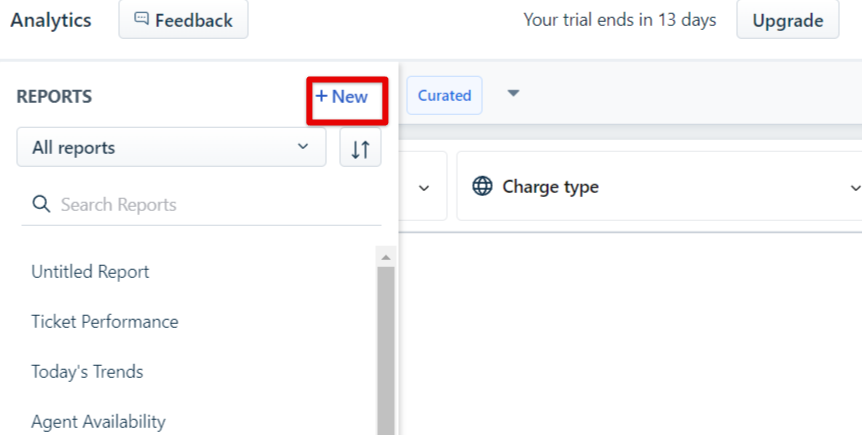
2. Option for creating customized Reports
This feature enables users to create customized reports as per their specific requirements. It allows users to select the metrics which are relevant to them into the report. By providing this flexibility, users can generate reports to their needs.
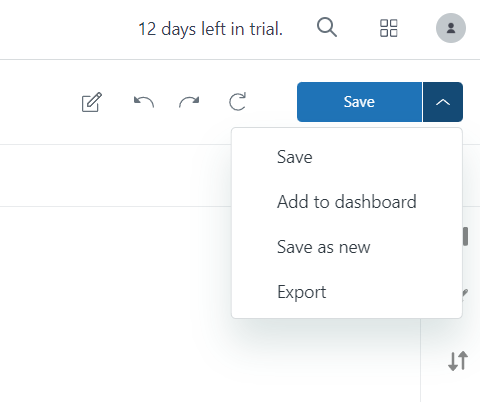
3. Option for Exporting Reports
This feature allows users to download or export generated reports in various file formats, such as Excel CSV, PDF, and more.
4. Visualization options in reports
This feature allows the users to represent their metrics in relevant manner. Different visualization options like Bar Charts, Pie Charts, Tabular Forms, Heat Maps, Stacked Column Charts can be used to represent metrics in more meaningful way.
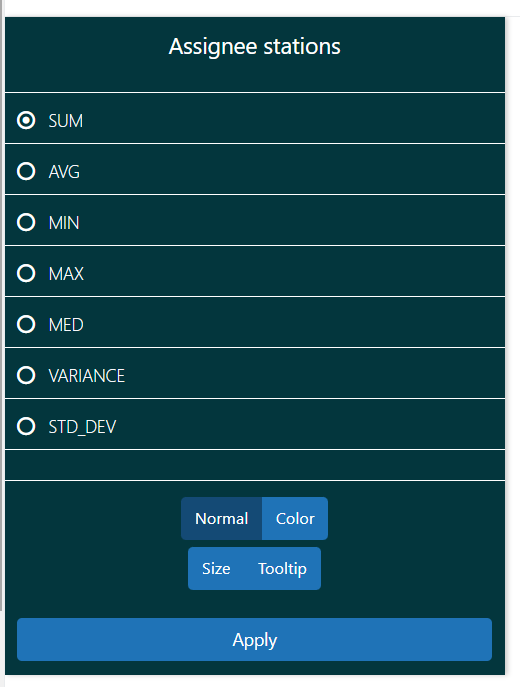
5. Mathematical functions for metrics
This feature allows users to use different mathematical operations like Sum, Average, Min, Max, Median to quantify metrics in a meaningful manner.